The complete data lifecycle: from ingestion to AI — what ten years of data projects have taught me

1. Data Collect — Data comes to life1. The Data Quality Wall: What the Data Really Says 1. Why the traditional project Cycle no longer worksArtificial Intelligence has its own language. And it's evolving fast.
Collection is the first act. It is the moment information leaves its source system to enter the analytical domain.
Technical: pipelines orchestrated via Azure Data Factory, Airflow, or Control-M, handling CSV, JSON, XML, Parquet, and streaming via Kafka or Event Hub. Fivetran or Airbyte connectors automate SaaS integrations but require precise configuration to manage API limits, history, incremental synchronization, and schema variations.
Business: Product Owners define what needs to be acquired, Business Analysts write the specifications, and Data Engineers build resilient, versioned, and monitored pipelines.
What I’ve learned: flawed data collection creates significant technical debt—missing data, duplicates, delays, and silent errors. I’ve seen projects delayed by three months, not because of ML or reporting, but because the initial ingestion was poorly scoped.
The “so what” for your organization Never start an ingestion pipeline without answering three questions: (1) Who owns each source? (2) What is the contractual update frequency, and what do you do if it breaks? (3) What is your disaster recovery strategy?
2. Data Storage — Building a durable data architecture2. Our Approach: Alteryx as the Backbone of Data Quality 2. Our conviction: start with the business pain point, not the technology1. LLM (Large Language Model)
Three main architectures: Data Lake for raw data, Data Warehouse for structured analysis, and Lakehouse to combine flexibility and performance.
Organized into zones: RAW (immutable raw data, the source of truth), CLEAN (harmonized and cleaned), CURATED (ready for analysis or AI).
Data Architects define the structure, formats (Parquet, Delta), partitioning, compression, and governance. Purview and Unity Catalog are used for traceability and lineage. Fine-grained access control (RBAC, ACL), encryption, and lifecycle management are essential for controlling cloud costs.
What I’ve learned: storage is never just about “putting files somewhere.” It’s a strategic choice. A poor Parquet partitioning strategy can make a query take 10 times longer to execute.
The “so what” Test it on your current stack: how long does an analytical query take on your last 12 months of data? If the answer is “it depends” or “10 minutes,” you have an architecture problem, not an analytics one.

3. Data Cleaning & Transformation — Improving data quality3. Two Tool Families, One Unified Philosophy 3. A six-step method, not six months2. Embeddings
Data Engineers use SQL, Spark/Databricks, Python, and DBT. Business Analysts define the business rules—essential for avoiding misinterpretation. Data Engineers use SQL, Spark/Databricks, Python, and DBT. Business Analysts define the business rules—essential for avoiding misinterpretation.
Technically: outlier detection, format harmonization, intelligent null handling, feature engineering, and enrichment with external sources. Automated testing tools: Great Expectations, DBT tests. Technically: outlier detection, format harmonization, intelligent null handling, feature engineering, and enrichment with external sources. Automated testing tools: Great Expectations, DBT tests.
What I’ve learnedWhat I’ve learned: clean data is a prerequisite, not a competitive advantage. I’ve seen a brilliant ML project produce catastrophic results in production because 8% of the training records contained the same formatting error that went undetected upstream.: clean data is a prerequisite, not a competitive advantage. I’ve seen a brilliant ML project produce catastrophic results in production because 8% of the training records contained a formatting error that went undetected upstream.
The “so what”The "so what" Implement quality controls starting in the RAW Zone, using versioned automated tests. What you don't test upstream, you will pay for downstream. Implement quality controls starting in the RAW zone, using versioned automated tests. What you don't test upstream, you will pay for downstream.

4. Data Modeling — Giving data shape and making it intelligible4. A Sample of Our AI Data Quality Tools for Alteryx4. Prime AI Fast Development Kit: the engine that makes it possible3. RAG (Retrieval-Augmented Generation)
Star schemas provide simplicity and speed, while snowflake schemas offer normalization. Slowly Changing Dimensions are used to track changes over time. Semantic layers in Power BI or Looker centralize business logic.
Data Engineers optimize performance through partitioning, clustering, and indexing. Business Analysts validate compliance with actual business processes.
What I’ve learned: a poorly designed model creates KPI discrepancies between teams that, over time, become a source of distrust in the data.
The "so what" Every critical KPI should have a single, versioned, and documented definition, supported by a designated owner. If your CFO and your Sales Director calculate "revenue" differently, it’s not a tool problem—it’s a modeling problem.

5. Data Analysis — Uncovering insights in data 5. The Typical Pipeline: How to Integrate These Tools 5. What concretely changes for business4. Agentic AI / Agentic AI
Data Analysts use SQL, Python, Power BI, Tableau, and Looker. They perform exploratory data analysis (EDA) in Python, analyze correlations, conduct time-series comparisons, and build measures using DAX or LookML.
What I’ve learned: an insight is not just a metric—it is contextualized understanding. A brilliant Data Analyst is worth more than three average Data Scientists.
The "so what" Invest in your team's critical analysis culture, not just their tools. A good analyst knows to question an odd figure before including it in a report.
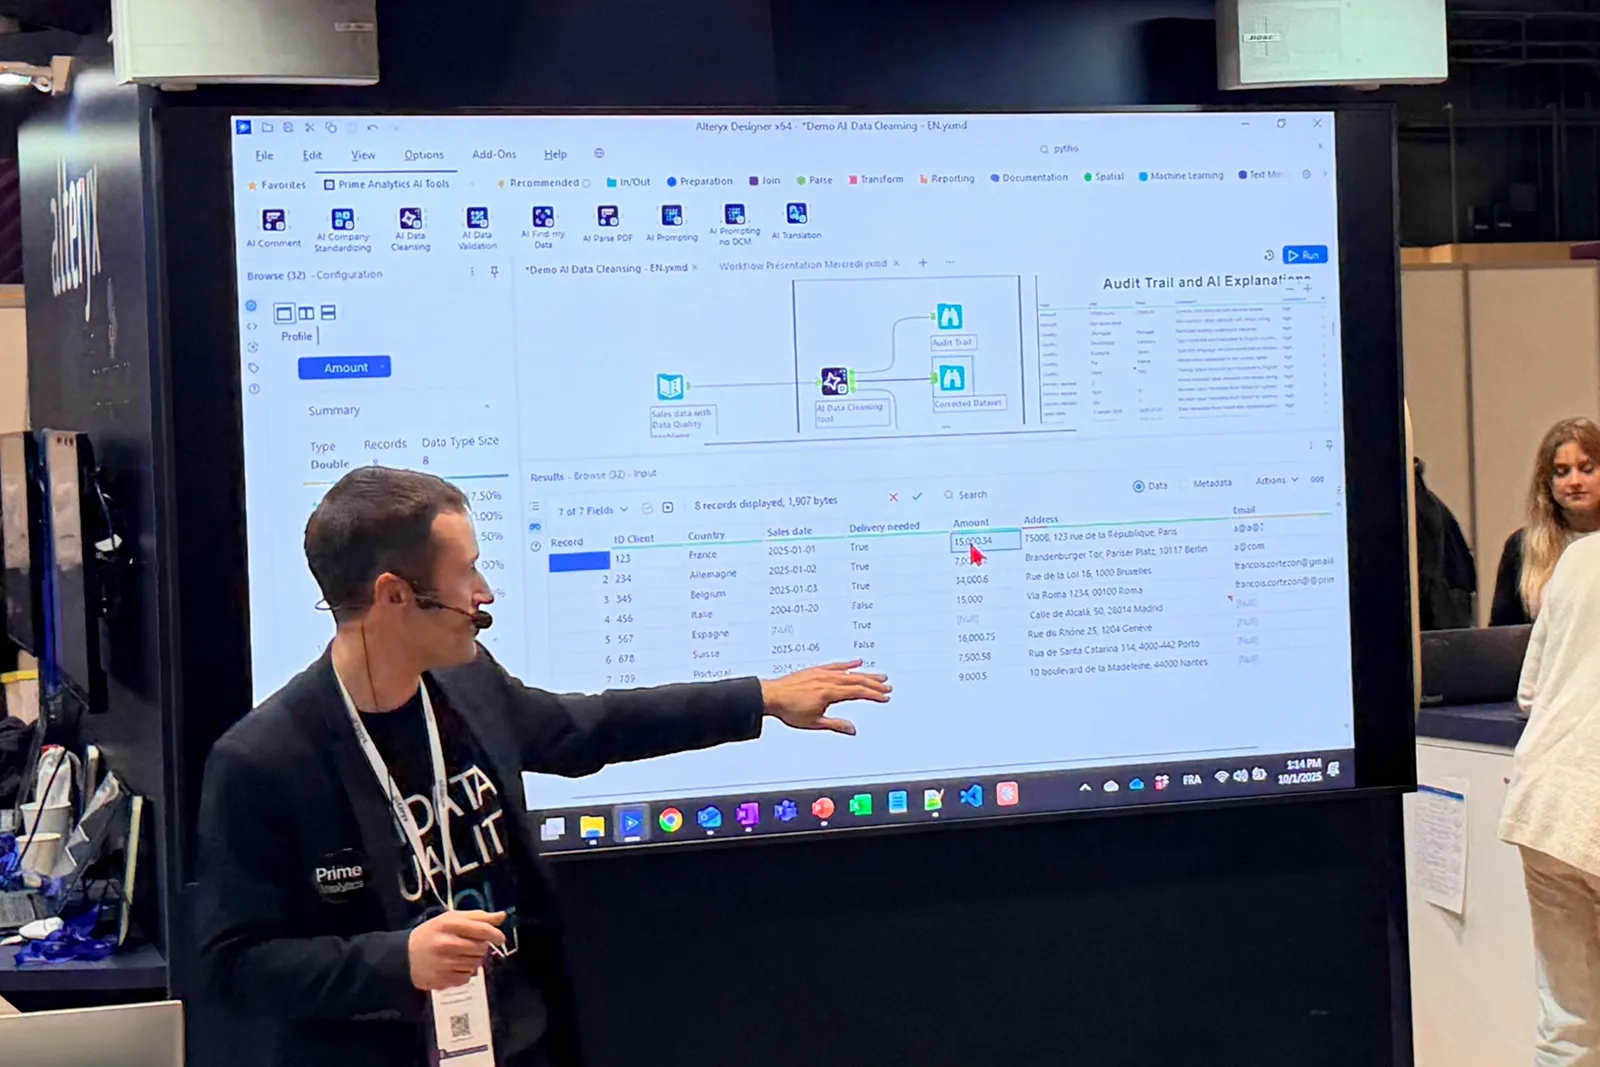
6. Data Visualization — Turning data into an intuitive experience 6. Our Philosophy: Four Non-Negotiable Principles 6. A real-world example: the AI & Credit Masterclass on June 23, 20265. Orchestrator
Power BI, Tableau, and Looker enable interactive visualizations. Key focus areas include UX principles, storytelling, and ergonomics. Technically, this involves optimizing models for refresh rates, implementing filters and drill-downs, maintaining strict KPI governance, and managing capacity.
What I’ve learned: a good dashboard is a tool for immediate decision-making. A bad one can lead a company into a flawed strategy—I once saw a dashboard "read" as a growth signal for two quarters, while a calculation artifact was masking a real decline.
The "so what" Before delivering a dashboard, have it tested by someone who didn't design it. If it takes them more than 30 seconds to understand the main message, rework it.
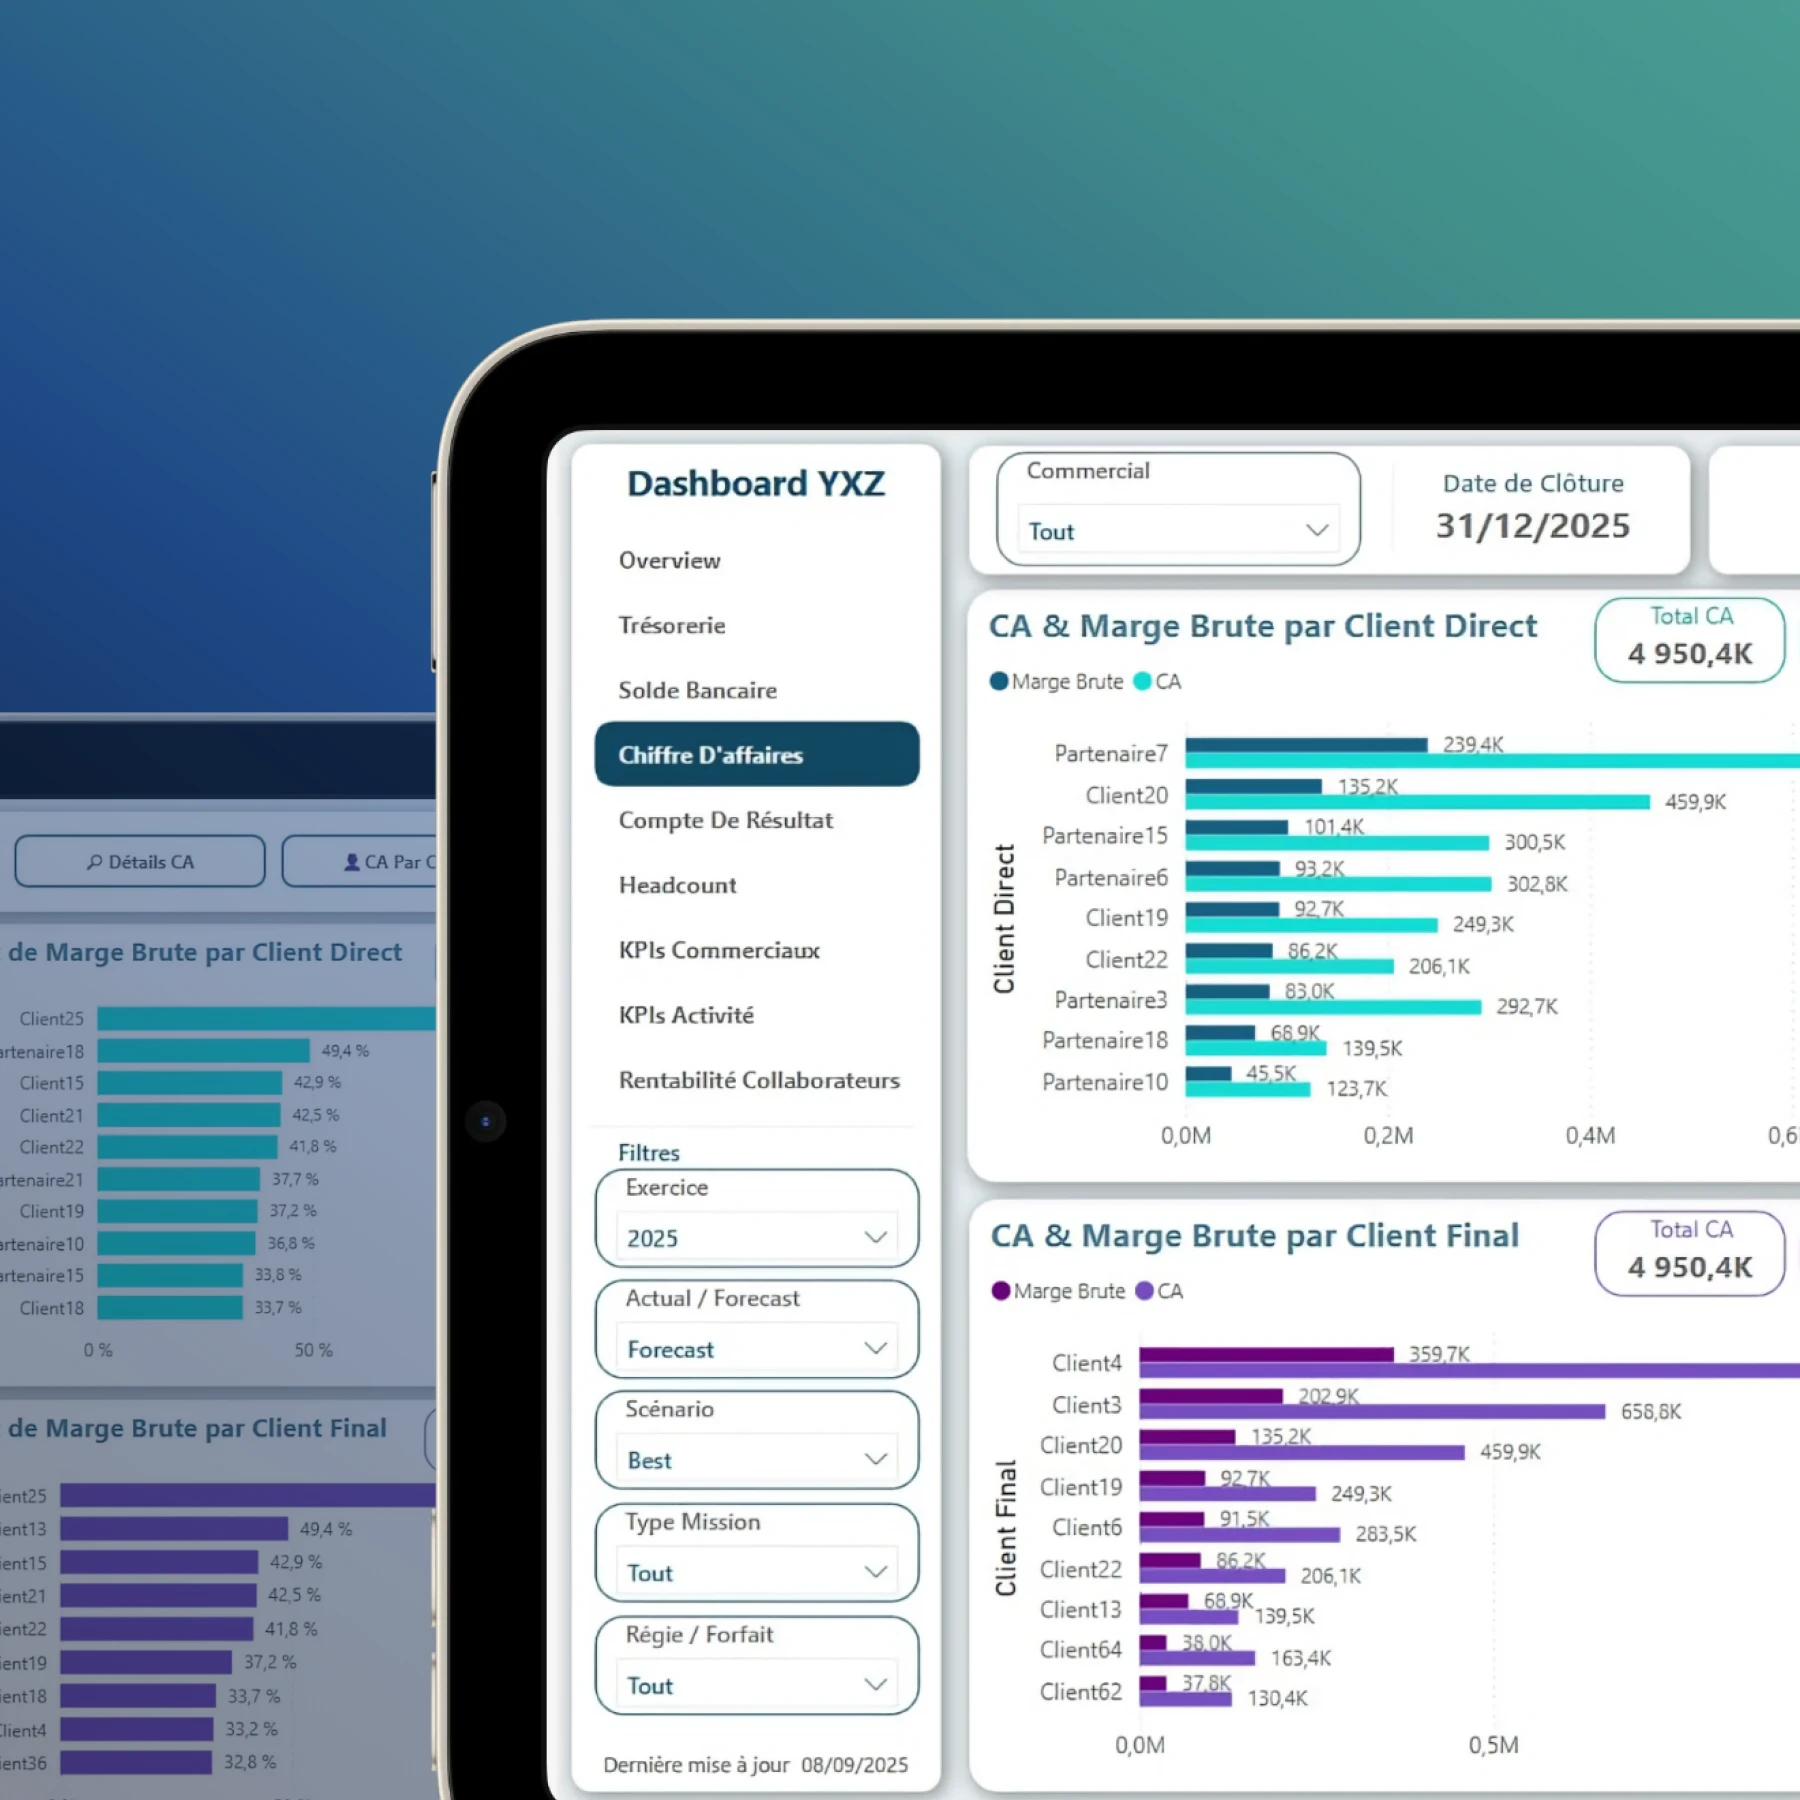
7. Artificial Intelligence — Data becomes proactive, predictive, and generative7. Why we chose to make these tools free 7. Beyond prototypes, a transformation roadmapAn expanding AI glossary
Data Scientists: supervised/unsupervised models (XGBoost, LightGBM, RandomForest), churn, scoring, fraud, recommendation.
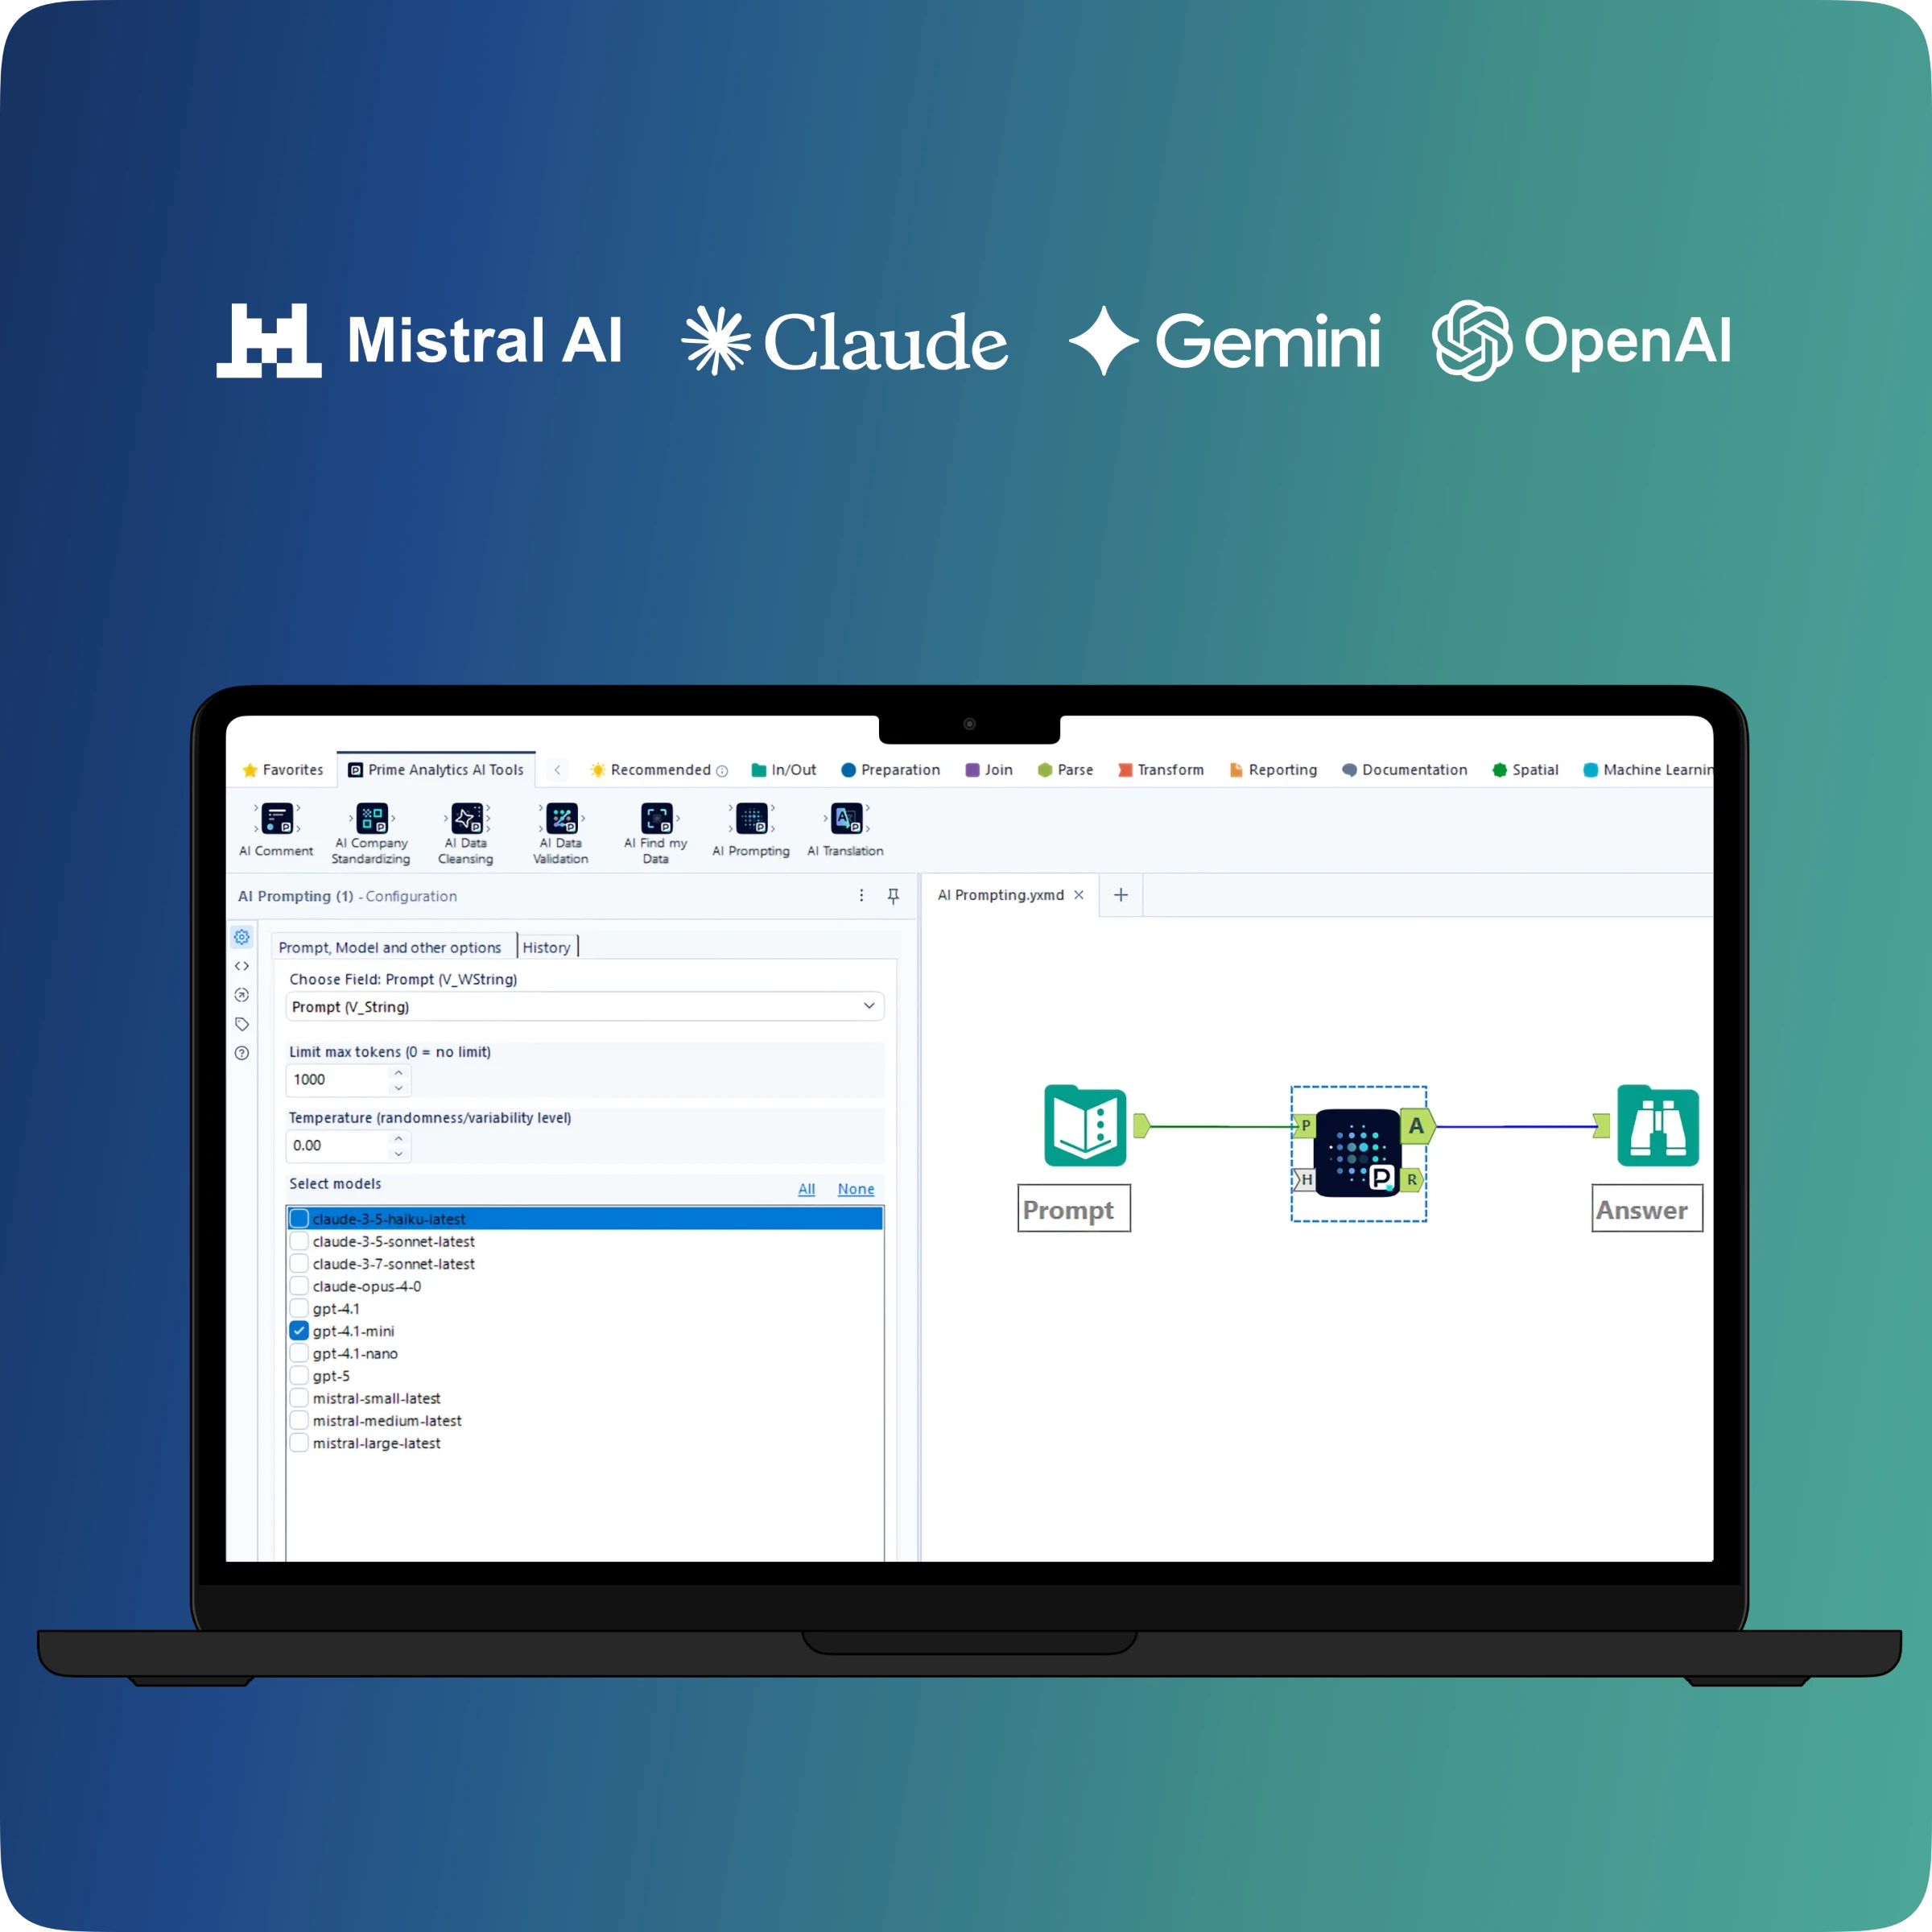
AI Engineers: language models (GPT, Llama, Mistral, Claude), agents, business assistants.
RAG architectures: embeddings + vector store (Pinecone, Weaviate) + LLM. MLOps: monitoring, drift, retraining, CI/CD.
What I’ve learned: without MLOps, an ML model in production will silently drift within 6 to 12 months. It’s an underestimated trap.
The "so what" Before launching an ambitious AI project, brutally audit the quality of your data pipeline across the previous six stages. An AI project built on a faulty foundation is a guaranteed waste of resources.
The pipeline: a collective effort
The data lifecycle is an ecosystem. Data collected without rigor skews analysis. Transformation without business expertise distorts metrics. AI trained on poor-quality data produces flawed recommendations.
The data pipeline is not just a technical process — it is a culture. Organizations that master this cycle make better decisions, faster and with greater confidence.
In a world where data is everywhere, it is not the quantity that creates value, but how it is guided throughout this cycle. Data alone means nothing — it is the pipeline that brings it to life.
A legitimate question: if these tools required several months of development, why make them free?
First, because Data Quality is a collective challenge. The French-speaking Alteryx ecosystem is rich but fragmented. Each team individually solves the same problems. Pooling robust tools helps everyone progress — including our competitors. We embrace that.
Next, because these tools are a gateway. A CDO who downloads the library, installs it, tests it, and discovers it works — starts to get to know us. When they have a real Data Quality transformation project, they will think of us.
Finally, because our business is not selling tools. Our business is consulting, managed services, and training. The tools are one of the supports for our expertise — not our main product.
The 'so what'
If you are an Alteryx user in banking, insurance, or a large enterprise: download the pack, test it on one or two internal use cases, and see for yourself. No commitment, no cost. If it works for you, let's talk.
Reliable data allows an AI project to launch in 3 months instead of 18. It enables rapid iteration, testing multiple approaches, and scaling. Conversely, questionable data slows everything down — every decision becomes a debate, every anomaly an investigation, every deliverable a compromise.
Our AI Data Quality tools for Alteryx are designed to make this quality accessible, industrial, and sustainable — without extra effort for teams, without vendor lock-in, and without compromising sovereignty.
They are free. They are proven in demanding banking environments. They are designed to be understood and used by business teams — not just by Data Engineers.
All that's left is to try them.

We will get back to you as soon as possible.
Please try again or contact us at contact@primeanalytics.fr.